
I have been working with Golang since 3 years ago, I love it because of its performance and lightweight. Golang also has good built-in tools that absolutely help you in development. One of that is pprof, a tools for profiling data and visualize it. By analyzing profiling data from pprof, we will able to identify which part that consume lots of memory and time. Awesome right!!!
In my previous company 2018, I was facing an OOM issue after using a 3rd party package in my service. There was OK in local and staging, but after deploying to production, BOOM!!! The memory usage is increasing drastically, reached 100%, and down. I have no idea whats going on because there is no error recorded in the log (before reached 100%). The only thing that different between production and staging is the traffic.

After debugging for some hours, I was very lucky to know Golang has pprof. I was able to identify the culprit and fix the code. I was amazed by this tools, I even did a little sharing session after the outage to spread it across my engineer division. And finally I can share in this article as well. Please find the material on https://github.com/w-bt/benchmark_v2
Prerequisite
- Golang 1.11 or newer (I am using 1.14 when I created this article)
- Benchcmp (go get golang.org/x/tools/cmd/benchcmp)
- Any editor
Test Case
Let’s say we have a lot of products data that stored in global variable products. Each product has name and code. Function GenerateProduct() (in data.go) generates products, we can also assume this data coming from database / other service. I’ve created a simple end point to get the product based on its code.
package main

import (
	"log"
	"net/http"
	"regexp"
)

var products map[string]*Product

func init() {
	GenerateProduct()
}

func main() {
	log.Printf("Starting on port 1234")
	http.HandleFunc("/product", handleProduct)
	log.Fatal(http.ListenAndServe("127.0.0.1:1234", nil))
}

func handleProduct(w http.ResponseWriter, r *http.Request) {
	code := r.FormValue("code")
	if match, _ := regexp.MatchString(`^[A-Z]{2}[0-9]{2}$`, code); !match {
		http.Error(w, "code is invalid", http.StatusBadRequest)
		return
	}

	result := findProduct(products, code)

	if result.Code == "" {
		http.Error(w, "Data Not Found", http.StatusBadRequest)
		return
	}

	w.Header().Set("Content-Type", "text/html; charset=utf-8")
	w.Write([]byte(`<font size="10">Product Code : ` + result.Code + ` Name :` + result.Name + `</font>`))
}

func findProduct(Products map[string]*Product, code string) Product {
	for _, item := range Products {
		if code == (*item).Code {
			return *item
		}
	}

	return Product{}
}
Run It
$ go build && ./benchmark
Open browser and hit http://localhost:1234/product?code={code}.
Test
In order to understand the intent of the code, bellow is the happy path test
package main

import (
	"bufio"
	"net/http"
	"net/http/httptest"
	"os"
	"strings"
	"testing"
)

func TestMain(m *testing.M) {
	GenerateProduct()

	code := m.Run()

	os.Exit(code)
}

func TestHandleProduct(t *testing.T) {
	r, _ := http.NewRequest("GET", "/product?code=AA11", nil)
	w := httptest.NewRecorder()
	handleProduct(w, r)
	if !strings.Contains(w.Body.String(), "Product Code") {
		t.Error("An error was not expected")
	}
}
$ go test -cover -race -v
=== RUN   TestHandleProduct
--- PASS: TestHandleProduct (0.00s)
PASS
coverage: 73.3% of statements
ok  	github.com/w-bt/benchmark	2.048s
GO TEST BENCHMARK
Here we go. We need to hit the end point for multiple times to get accurate profiling data. Lets use testing.B instead of testing.T (the B refer to Benchmark). In this benchmark test, please note:
- b.ReportAllocs() is necessary to enable malloc statistics
- need to reset the response for each call (see func reset(rw *httptest.ResponseRecorder))
func BenchmarkHandleProduct(b *testing.B) {
	b.ReportAllocs()
	r, _ := http.ReadRequest(bufio.NewReader(strings.NewReader("GET /product?code=ZZ99 HTTP/1.0\r\n\r\n")))
	rw := httptest.NewRecorder()
	for i := 0; i < b.N; i++ {
		handleProduct(rw, r)
		rw.Body.Reset()
	}
}
Then execute it for some times (in this case 30000 times). The longer we take, the more accurate result we get. Flag cpuprofile is used to generate profiling data in time unit, flag memprofile is used to generate profiling data in bytes unit, flag o is used to save test binary to other file name.
$ go test -v -bench=. -benchtime=30000x -cpuprofile=prof.cpu -memprofile=prof.mem -o bench.test | tee prof.txt
goos: darwin
goarch: amd64
pkg: github.com/w-bt/benchmark_v2/opt_1
BenchmarkHandleProduct
BenchmarkHandleProduct-12          30000           1295360 ns/op            3354 B/op         49 allocs/op
PASS
ok      github.com/w-bt/benchmark_v2/opt_1      40.408s
This command produces 4 new files:
- binary test (bench.test)
- cpu profile (prof.cpu)
- memory profile (prof.mem)
- benchmark result (prof1)
Based on the data above, below is detailed result:
- total execution: 30000 times
- duration each operation: 1058075 ns/op
- each iteration costs: 3354 bytes with 49 allocations
CPU Profiling
Now we are done with profiling, lets take a look the result
$ go tool pprof bench.test prof.cpu
File: bench.test
Type: cpu
Time: Mar 4, 2021 at 11:36am (WIB)
Duration: 31.67s, Total samples = 30.06s (94.92%)
Entering interactive mode (type "help" for commands, "o" for options)
(pprof) top
Showing nodes accounting for 34.55s, 95.89% of 36.03s total
Dropped 104 nodes (cum <= 0.18s)
Showing top 10 nodes out of 29
      flat  flat%   sum%        cum   cum%
    15.21s 42.21% 42.21%     15.21s 42.21%  memeqbody
     7.42s 20.59% 62.81%     31.26s 86.76%  github.com/w-bt/benchmark_v2/opt_1.findProduct
     6.89s 19.12% 81.93%      8.13s 22.56%  runtime.mapiternext
     2.83s  7.85% 89.79%      2.83s  7.85%  aeshashbody
     0.50s  1.39% 91.17%      0.50s  1.39%  runtime.memequal
     0.48s  1.33% 92.51%      0.48s  1.33%  runtime.madvise
     0.45s  1.25% 93.76%      0.45s  1.25%  runtime.nanotime1
     0.35s  0.97% 94.73%      0.35s  0.97%  runtime.add
     0.21s  0.58% 95.31%      0.21s  0.58%  runtime.(*bmap).overflow (inline)
     0.21s  0.58% 95.89%      0.21s  0.58%  runtime.(*maptype).indirectkey
(pprof) top5
Showing nodes accounting for 32850ms, 91.17% of 36030ms total
Dropped 104 nodes (cum <= 180.15ms)
Showing top 5 nodes out of 29
      flat  flat%   sum%        cum   cum%
   15210ms 42.21% 42.21%    15210ms 42.21%  memeqbody
    7420ms 20.59% 62.81%    31260ms 86.76%  github.com/w-bt/benchmark_v2/opt_1.findProduct
    6890ms 19.12% 81.93%     8130ms 22.56%  runtime.mapiternext
    2830ms  7.85% 89.79%     2830ms  7.85%  aeshashbody
     500ms  1.39% 91.17%      500ms  1.39%  runtime.memequal
(pprof) top --cum
Showing nodes accounting for 32.36s, 89.81% of 36.03s total
Dropped 104 nodes (cum <= 0.18s)
Showing top 10 nodes out of 29
      flat  flat%   sum%        cum   cum%
     0.01s 0.028% 0.028%     34.63s 96.11%  github.com/w-bt/benchmark_v2/opt_1.BenchmarkHandleProduct
         0     0% 0.028%     34.63s 96.11%  testing.(*B).launch
         0     0% 0.028%     34.63s 96.11%  testing.(*B).runN
         0     0% 0.028%     34.62s 96.09%  github.com/w-bt/benchmark_v2/opt_1.handleProduct
     7.42s 20.59% 20.62%     31.26s 86.76%  github.com/w-bt/benchmark_v2/opt_1.findProduct
    15.21s 42.21% 62.84%     15.21s 42.21%  memeqbody
     6.89s 19.12% 81.96%      8.13s 22.56%  runtime.mapiternext
         0     0% 81.96%      2.84s  7.88%  net/http.Header.Set (inline)
         0     0% 81.96%      2.84s  7.88%  net/textproto.MIMEHeader.Set (inline)
     2.83s  7.85% 89.81%      2.83s  7.85%  aeshashbody
(pprof)
Detailed informations:
- top: show 10 top functions that takes a lot of resources
- top5: show 5 top functions that takes a lot of resources
- top –cum: show 10 top function that takes a lot of resources based on cum (descending)
- flat: the duration of direct operation inside the function (function call doesn’t count as flat)
- flat%: flat percentage
(flat/total flats)*100 - sum%: sum of current flat% and previous flat%, sum% could help you to identify the big rocks quickly
- cum: cumulative duration for the function, it is the value of the location plus all its descendants.
- cum%: cumulative percentage
(cum/total cum)*100
Flat and Sum
Assuming there is a function foo, which is composed of 2 functions and a direct operation.
func foo(){
    a()                                 // step1
    direct operation                    // step2
    b()                                 // step3
}
In example when we hit foo, it takes 4 seconds, and the time distribution are following.
func foo(){
    a()                                 // step1 takes 1s
    direct operation                    // step2 takes 2s
    b()                                 // step3 takes 1s
}
flat would be the time spent on step2. cum would be the total execution time of foo, which contains sub-function call and direct operations. (cum = step1 + step2 + step3)
Now, based on data above, func findProduct takes 26.40s, hmmm.. suspicious isn’t it? lets see more detail:
(pprof) list handleProduct
Total: 36.03s
ROUTINE ======================== github.com/w-bt/benchmark_v2/opt_1.handleProduct in /Users/pt.gojekindonesia/Documents/code/go/src/github.com/w-bt/benchmark_v2/opt_1/main.go
         0     34.62s (flat, cum) 96.09% of Total
         .          .     18:   http.HandleFunc("/product", handleProduct)
         .          .     19:   log.Fatal(http.ListenAndServe("127.0.0.1:1234", nil))
         .          .     20:}
         .          .     21:
         .          .     22:func handleProduct(w http.ResponseWriter, r *http.Request) {
         .       20ms     23:   code := r.FormValue("code")
         .      430ms     24:   if match, _ := regexp.MatchString(`^[A-Z]{2}[0-9]{2}$`, code); !match {
         .          .     25:           http.Error(w, "code is invalid", http.StatusBadRequest)
         .          .     26:           return
         .          .     27:   }
         .          .     28:
         .     31.26s     29:   result := findProduct(products, code)
         .          .     30:
         .          .     31:   if result.Code == "" {
         .          .     32:           http.Error(w, "data not found", http.StatusBadRequest)
         .          .     33:           return
         .          .     34:   }
         .          .     35:
         .      2.84s     36:   w.Header().Set("Content-Type", "text/html; charset=utf-8")
         .       70ms     37:   w.Write([]byte(`<font size="10">Product Code : ` + result.Code + ` Name :` + result.Name + `</font>`))
         .          .     38:}
         .          .     39:
         .          .     40:func findProduct(Products map[string]*Product, code string) *Product {
         .          .     41:   for _, item := range Products {
         .          .     42:           if code == (*item).Code {
(pprof) list findProduct
Total: 36.03s
ROUTINE ======================== github.com/w-bt/benchmark_v2/opt_1.findProduct in /Users/pt.gojekindonesia/Documents/code/go/src/github.com/w-bt/benchmark_v2/opt_1/main.go
     7.42s     31.26s (flat, cum) 86.76% of Total
         .          .     36:   w.Header().Set("Content-Type", "text/html; charset=utf-8")
         .          .     37:   w.Write([]byte(`<font size="10">Product Code : ` + result.Code + ` Name :` + result.Name + `</font>`))
         .          .     38:}
         .          .     39:
         .          .     40:func findProduct(Products map[string]*Product, code string) *Product {
     760ms      8.89s     41:   for _, item := range Products {
     6.66s     22.37s     42:           if code == (*item).Code {
         .          .     43:                   return item
         .          .     44:           }
         .          .     45:   }
         .          .     46:
         .          .     47:   return &Product{}
(pprof)
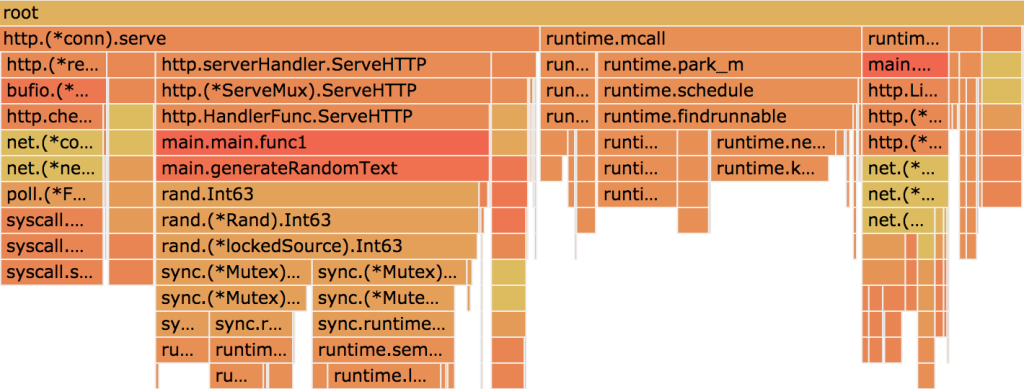
To see in UI form, use web:
Found it, it is because we do looping all of the products and compare it one by one. Even it has O(n), it doesn’t make sense if we have million or billion data.
Interpreting The CallGraph
- Node Color:
- large positive cum values are red.
- cum values close to zero are grey.
- Node Font Size:
- larger font size means larger absolute flat values.
- smaller font size means smaller absolute flat values.
- Edge Weight:
- thicker edges indicate more resources were used along that path.
- thinner edges indicate fewer resources were used along that path.
- Edge Color:
- large positive values are red.
- values close to zero are grey.
- Dashed Edges: some locations between the two connected locations were removed.
- Solid Edges: one location directly calls the other.
- “(inline)” Edge Marker: the call has been inlined into the caller.
Memory Profiling
Similar with CPU Profiling, execute this command
$ go tool pprof bench.test prof.mem
File: bench.test
Type: alloc_space
Time: Mar 14, 2021 at 4:05pm (WIB)
Entering interactive mode (type "help" for commands, "o" for options)
(pprof) top --cum
Showing nodes accounting for 32MB, 29.99% of 106.70MB total
Dropped 3 nodes (cum <= 0.53MB)
Showing top 10 nodes out of 39
flat flat% sum% cum cum%
0 0% 0% 96.52MB 90.46% github.com/w-bt/benchmark_v2/opt_1.BenchmarkHandleProduct
3.50MB 3.28% 3.28% 96.52MB 90.46% github.com/w-bt/benchmark_v2/opt_1.handleProduct
0 0% 3.28% 96.52MB 90.46% testing.(*B).launch
0 0% 3.28% 96.52MB 90.46% testing.(*B).runN
0 0% 3.28% 92.02MB 86.24% regexp.Compile (inline)
0 0% 3.28% 92.02MB 86.24% regexp.MatchString
5.50MB 5.16% 8.44% 92.02MB 86.24% regexp.compile
0 0% 8.44% 31.01MB 29.06% regexp.compileOnePass
3MB 2.81% 11.25% 25MB 23.43% regexp/syntax.Parse
20MB 18.75% 29.99% 20MB 18.75% regexp/syntax.(*parser).newRegexp (inline)
(pprof) list handleProduct
Total: 106.70MB
ROUTINE ======================== github.com/w-bt/benchmark_v2/opt_1.handleProduct in /Users/pt.gojekindonesia/Documents/code/go/src/github.com/w-bt/benchmark_v2/opt_1/main.go
3.50MB 96.52MB (flat, cum) 90.46% of Total
. . 19: log.Fatal(http.ListenAndServe("127.0.0.1:1234", nil))
. . 20:}
. . 21:
. . 22:func handleProduct(w http.ResponseWriter, r *http.Request) {
. . 23: code := r.FormValue("code")
. 92.02MB 24: if match, _ := regexp.MatchString(`^[A-Z]{2}[0-9]{2}$`, code); !match {
. . 25: http.Error(w, "code is invalid", http.StatusBadRequest)
. . 26: return
. . 27: }
. . 28:
. . 29: result := findProduct(products, code)
. . 30:
. . 31: if result.Code == "" {
. . 32: http.Error(w, "data not found", http.StatusBadRequest)
. . 33: return
. . 34: }
. . 35:
. 1MB 36: w.Header().Set("Content-Type", "text/html; charset=utf-8")
3.50MB 3.50MB 37: w.Write([]byte(`<font size="10">Product Code : ` + result.Code + ` Name :` + result.Name + `</font>`))
. . 38:}
. . 39:
. . 40:func findProduct(Products map[string]*Product, code string) *Product {
. . 41: for _, item := range Products {
. . 42: if code == (*item).Code {
(pprof) list MatchString
Total: 106.70MB
ROUTINE ======================== regexp.MatchString in /usr/local/Cellar/go/1.14.2/libexec/src/regexp/regexp.go
0 92.02MB (flat, cum) 86.24% of Total
. . 526:
. . 527:// MatchString reports whether the string s
. . 528:// contains any match of the regular expression pattern.
. . 529:// More complicated queries need to use Compile and the full Regexp interface.
. . 530:func MatchString(pattern string, s string) (matched bool, err error) {
. 92.02MB 531: re, err := Compile(pattern)
. . 532: if err != nil {
. . 533: return false, err
. . 534: }
. . 535: return re.MatchString(s), nil
. . 536:}
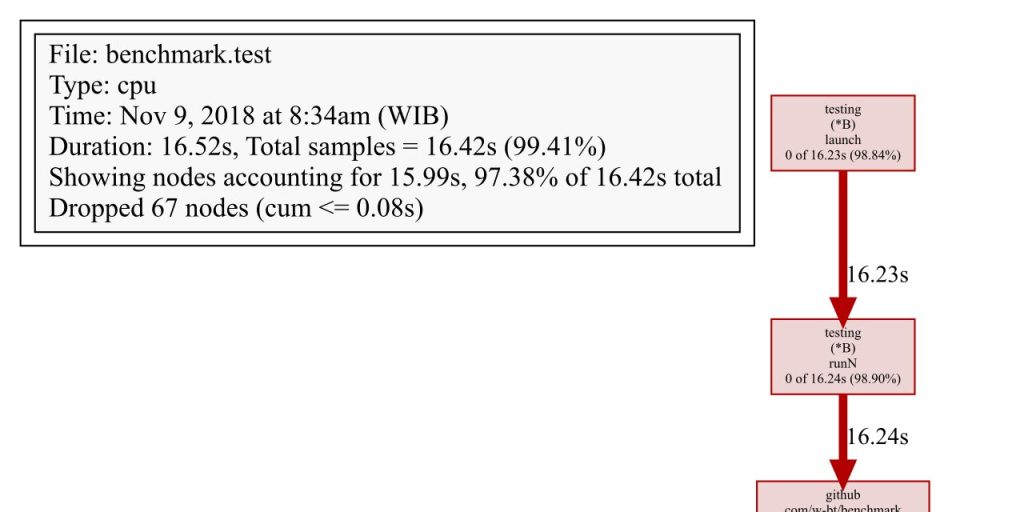
(pprof) web handleProduct
Please ignore GenerateProduct (as I mention before, we can assume the data coming from database). Based on data above, regexp.MatchString takes the most memory. It takes 92.02MB!!! After digging deeper, it is make sense because we need to compile everytime we execute it. Imagine if we have more complex pattern, hahaha
Another thing we should consider is http response writer, It takes 3MB. Even it is not a big deal comparing to the regex issue, we can tune it.
Another Way
Use Web Version!!!! Open localhost:8081, it shown beautiful graph, you’ll love it!
$ go tool pprof -http=":8081" [binary] [profile]
OPTIMIZATION
UPDATE FINDPRODUCT()
why looping it if we can lookup the hash. It improves the complexity from O(n) to O(1).
func findProduct(Products map[string]*Product, code string) Product {
	if v, ok := Products[code]; ok {
		return *v
	}

	return Product{}
}
$ go test -v -bench=. -benchtime=30000x -cpuprofile=prof.cpu -memprofile=prof.mem -o bench.test | tee prof.txt
goos: darwin
goarch: amd64
pkg: github.com/w-bt/benchmark/opt_2
BenchmarkHandleProduct
BenchmarkHandleProduct-12          30000              4529 ns/op            3353 B/op         49 allocs/op
PASS
ok      github.com/w-bt/benchmark/opt_2 1.618s
Now we can compare prof1 (before) and prof2 (after) and see the different (delta)
$ benchcmp ../opt_1/prof.txt prof.txt
benchmark                     old ns/op     new ns/op     delta
BenchmarkHandleProduct-12     1295360       4529          -99.65%

benchmark                     old allocs     new allocs     delta
BenchmarkHandleProduct-12     49             49             +0.00%

benchmark                     old bytes     new bytes     delta
BenchmarkHandleProduct-12     3354          3353          -0.03%
In operation time, the delta is -99.65%, so it improve around ~286x.
UPDATE REGEX
The idea is compiling regex first and use it multiple times
codeRegex = regexp.MustCompile(`^[A-Z]{2}[0-9]{2}$`)
// . . .
if match := codeRegex.MatchString(code); !match {
	// . . .
}
$ go test -v -bench=. -benchtime=30000x -cpuprofile=prof.cpu -memprofile=prof.mem -o bench.test | tee prof.txt
goos: darwin
goarch: amd64
pkg: github.com/w-bt/benchmark/opt_3
BenchmarkHandleProduct
BenchmarkHandleProduct-12          30000               386 ns/op             144 B/op          3 allocs/op
PASS
ok      github.com/w-bt/benchmark/opt_3 1.485s
$ benchcmp ../opt_2/prof.txt prof.txt
benchmark                     old ns/op     new ns/op     delta
BenchmarkHandleProduct-12     4529          386           -91.48%

benchmark                     old allocs     new allocs     delta
BenchmarkHandleProduct-12     49             3              -93.88%

benchmark                     old bytes     new bytes     delta
BenchmarkHandleProduct-12     3353          144           -95.71%
It improves all of aspects, operation times, allocations, and bytes consuming around 9x better.
UPDATE CONCATE STRING
The idea is using bytes.Buffer. It allows us to reuse memory without allocate.
var buf       = new(bytes.Buffer)
// . . .
buf.Reset()
buf.WriteString(`<font size="10">Product Code : `)
buf.WriteString(result.Code)
buf.WriteString(` Name :`)
buf.WriteString(result.Name)
buf.WriteString(`</font>`)
w.Write(buf.Bytes())
$ go test -v -bench=. -benchtime=30000x -cpuprofile=prof.cpu -memprofile=prof.mem -o bench.test | tee prof.txt
goos: darwin
goarch: amd64
pkg: github.com/w-bt/benchmark/opt_4
BenchmarkHandleProduct
BenchmarkHandleProduct-12          30000               300 ns/op              16 B/op          1 allocs/op
PASS
ok      github.com/w-bt/benchmark/opt_4 1.221s
$ benchcmp ../opt_3/prof.txt prof.txt
benchmark                     old ns/op     new ns/op     delta
BenchmarkHandleProduct-12     386           300           -22.28%

benchmark                     old allocs     new allocs     delta
BenchmarkHandleProduct-12     3              1              -66.67%

benchmark                     old bytes     new bytes     delta
BenchmarkHandleProduct-12     144           16            -88.89%
Yup, it improves a little for operation times, and improves lots of allocations. It prevents the generation of the unnecessary string object, means it doesn’t generate a new string like in + operator from two or more strings.
CONCLUSION
Golang has a lot of rich toolset, pprof is only one of them. With pprof we can identify memory leaks and improve the performance.